8.2 Confidence Intervals When s
Unknown: the T-Distribution
Goal: find confidence interval for m
when s is unknown (the usual case).
Approach: Proceed as before, using S (the sample variance)
in place of s.
-
previously, used fact that
 was standard normal to find confidence interval
-
now, look at
 to derive interval
Glitch: the distribution of  isnít a normal distribution!
Def: Let  ,
S be the sample mean & variance from sample of size n from a normal
population. Then the random variable
has a distribution called the T distribution with n-1 degrees of freedom
-
have a family of distributions, one for each degree of freedom
-
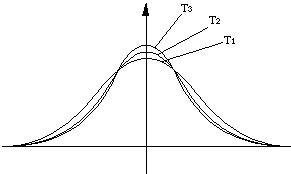
graphs of densities:

-
symmetric & have general shape of standard normal density, but are
broader
-
as
 ,
density of Tn approaches that of Z
-
use info about distribution to find a confidence intervals
95% confidence interval
-
look at
this quantity has the T-distribution with n-1 degrees of freedom
-
find interval such that the middle 95% of T-values lie in range:
-
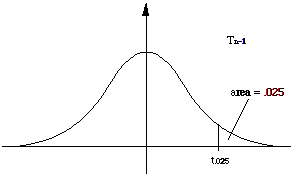
let t.025 be the value such that
P( T >= t.025) = .025, i.e., the area
under the density curve for T to the right of t.025
is .025; t.025 is called the upper .025 critical value

-
Then
P(-t.025 <= T <= t.025)
= .95 (i.e., the probability that T will lie between
+t.025 and -t.025 is .95)
so
i.e., for 95% of samples the value of  will lie in the range
-
Solving the inequality for m, we get that
for 95% of samples, m will lie in the range
This is our 95% confidence interval for m
-
The critical value can be found from (accurate) tables; note that its value
depends on n, the number of elements in the sample
-
Note: the number of degrees of freedom for a sample of size
n is n-1!!
ex:
Sample heights of 40 students; find  = 67.3", S = 3.6".
Then 95% confidence interval is
from tables (p. 732 in text), the .025 critical value for the T distribution
with 39 degrees of freedom is
gives
or our 95% confidence interval is
The same approach can be used to find confidence intervals for other
confidence levels; just use the appropriate critical values. Other commonly
used ones are 90% and 99% confidence intervals.
ex:
Note: when n is large, the density function for the T distribution
with n-1 degrees of freedom approaches that of the standard normal distribution;
thus for large n (n > 100), we can use the critical values from the Z distribution
as a good approximation to the values for the T distribution. (In fact,
most tables will only give critical values for the T distribution for n
up to about 100.)
ex:
Take a new sample of student heights; sample 200 students, find  = 67.7", S = 4.1"; find a 95% confidence interval for m
using this new data.
Interval is
table of critical values in text (p. 732) gives critical values only for
n up to 100; the next listed value is for n = *, which gives the critical
values for the Z distribution; these can be used for values of n larger
than 100. Thus use t.025 = 1.960, giving
or
Previous section Next
section
,
S be the sample mean & variance from sample of size n from a normal
population. Then the random variable