4.4 The Normal Distribution
Def: Let X be a continuous random variable. If its density is
then X has the normal distribution w/ parameters m,
s.
-
called a normal random variable
-
the parameters m and s
are the mean and standard deviation (hard to show directly; use moment
generating function (below))
-
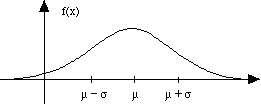
graph: "bell-shaped curve", w/ maximum at x = m,
inflection points at x = m
± s (use calculus to show
(prob. #43)):

-
it is true that
 ,
but requires some multivariable calculus tricks to show this!
Moment generating function:
(see text for derivation)
Can use this to find mean, variance:
Thus the parameters m, s
in the density function are in fact the mean and s.d.!
ex:
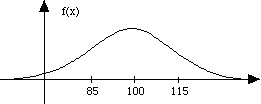
IQ scores are assigned in such a way that they are normally distributed
with mean 100 and standard deviation 15. Let X be the IQ score
of a person selected at random. What's the density function of X?
Since m = 100 and s
= 15, we get
Graph:

Note: there are lots of normal distributions, one for each
value of m, s
-
m determines where the center of
the distribution will be
-
the larger s is, the broader the
distribution
Def: The normal distribution with m
= 0, s = 1 is called standard normal
distribution; use variable Z to denote it.
Density function for Z is
f(x) = 
Finding probabilities for normal distributions
ex:
Approach:
-
tabulate values for the standard normal dist; see table V, appendix A,
p. 637;
the table gives values of P(Z <= z) for various values
of z
-
use the standardization theorem to transform a question about a
non-standard normal random variable X into one about the standard
normal random variable Z:
Theorem If X is normal, with mean m,
s.d. s, then  is a standard normal random variable. (Proof: find the moment generating
function of
  from the moment generating function of X using our rules for moment generating
functions discussed earlier, and see that it is the moment generating function
of a standard normal random variable.)
ex:
Previous section Next
section