4.6 Normal Approximation to the Binomial Distribution
recall:
Binomial distribution:
-
distribution of random variable X which counts # of successes in n independent
trials with probability of success p on each trial. (coin flips)
-
X is a discrete random variable
-
density function: f(x) =

-
mean: m = np
-
variance: var(X) = np(1 - p)
Recall that in the discrete case, density function gives probability
that particular outcomes will occur:
f(x) = P(X = x). Can present density function as a table
of values.
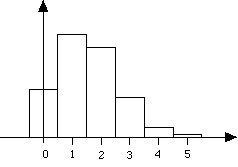
ex: binomial distribution with n=5, p=.30;
then density function f(x) given in table below:
Can represent the table as a histogram (bar graph):
(It is customary to center the bars over the values they represent.)
Then:
-
probability that particular value x will occur = height of bar over this
value:
P(X = x) =height of bar.
-
with widths of bars equal to 1, area of each bar = height * width = height;
thus
P(X = x) = area of bar.
-
Thus can use areas to find probabilities, as with continuous random variables;
P(X = x) = P(x - .5 <= X <=
x + .5) = area of bar between x - .5 and x + .5
In example above, to compute P(2 <= X <= 3), could approach as follows
P(2 <= X <= 3) = P(1.5 <= X <=
3.5)
= sum of areas of bars lying between x = 1.5 and x = 3.5
= .309 + .132 = .441
Of course, gives same result we'd get just by using density function table.
-
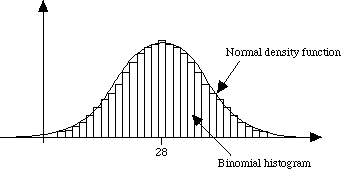
When n is large, tops of rectangles seem to form a smooth curve; if we
knew what this was, we could use it to find areas & hence probabilities
with integrals (instead of summing areas of bars).
Theorem Let X be binomial parameters n & p.
Then for n large, X is approximately normally distributed with mean
m = np, variance s2
= np(1-p).
-
i.e., the tops of rectangles in histogram form approximately a normal curve
w/same mean, variance
-
how large must n be for the approximation to be good? Approximation
good if np(1 - p) > 5.
Application
To use this result, compute probabilities for binomial random variables
by finding the area under the appropriate normal curve.
ex:
In an experiment 80 trees are grown under stressful conditions. Suppose
the probability of any one tree surviving is .35; whats the probability
that between 15 and 25 trees survive out of the 80?
Let X = # which survive; then X is binomial, w/ n=80, p=.35;
so
mean m = np = 80 (.35) = 28
variance s2 = np(1 - p)
= 80(.35)(.65) = 18.2
standard deviation s = 4.3
Want P(15 <= X <= 25).
Glitch:
-
tables dont go up to n=80
-
could compute as P(15 <= X <= 25) =
f(15) + f(16) + ... + f(25), using the formula for the density
function, but this is time-consuming!
Approach: Use a normal distribution to approximate the probability
Let Y be a normal random variable, with mean m
= 28, s.d. s = 4.3. Then X and Y have
approximately the same distribution, in the sense that if we drew the histogram
corresponding to X the tops of the bars would be very closely approximated
by the density function for Y.
Histogram for X:
ex:
Flip coin 200 times; whats probability get more than 120 heads?
Let X = # heads that occur in 200 flips; then X is binomial, with
n = 200 and p = .5,
mean = np = 200(.5) = 100, variance = np(1 - p) =
200(.5)(.5) = 50,
standard deviation = 7.1.
Want: P(X > 120)
Calculate using the normal approximation: let Y be normal, with
mean 100 and s.d. 7.1;
then P(X > 120) =
P(Y > 120.5)
Use standard normal r.v. Z to compute probability of normal
r.v. Y:
Z =  ;
when Y = 120.5, Z = 2.89,
;
when Y = 120.5, Z = 2.89,
so P(Y > 120.5) = P(Z > 2.89) =
1 - P(Z <= 2.89) = 1 - .9981
= .0019.
Thus P(X > 120) =
.0019, i.e., there's anly about a .2% chance that we'll get more than 120
heads in 200 flips of a (fair) coin.
Previous section Next
section