70, 68, 65, 69, 77, 62, 70, 70, 61, 72, 64, 62, 69, 72, 73, 69, 63, 72, 69, 71, 70, 64, 68, 75, 61
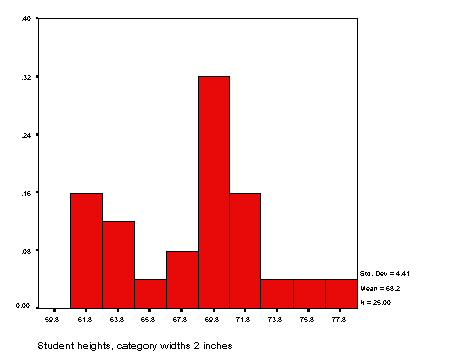
Create a histogram with category widths of 2 inches:
- the number of values in each category, and the percentages these represent, are given in the following table:
- the percentages in this table can be represented as a bar graph, giving the histogram:
| Categories | number | fraction |
| 61-62 inches | 4 | .16 |
| 63-64 | 3 | .12 |
| 65-66 | 1 | .04 |
| 67-68 | 2 | .08 |
| 69-70 | 8 | .32 |
| 71-72 | 4 | .16 |
| 73-74 | 1 | .04 |
| 75-76 | 1 | .04 |
| 77-78 | 1 | .04 |
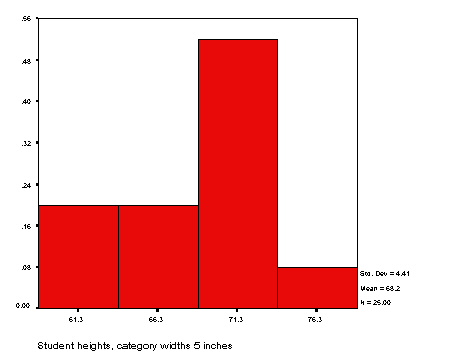
- the number of values in each category, and the percentages these represent, are given in the following table:
- representing the table as a bar graph, get the histogram:
| Categories | number | fraction |
| 59-63 | 5 | .20 |
| 64-68 | 5 | .20 |
| 69-73 | 13 | .52 |
| 74-78 | 2 | .08 |