(Updated for 2024) Where does health care funding come from, and where does it go? There’s a lot of opinion and speculation about this – I’ve often heard things like, “It’s those greedy insurance companies and their wealthy CEOs that make the costs so high!” Or, “The government is so inefficient – most of the Medicare money goes to government waste!” How do you determine if claims like this are true? Well, there’s actually data available: the Centers for Disease Control (CDC) and Centers for Medicare and Medicaid Services (CMS) collect a great deal of information about health care in the US, and publish this annually. This is provided on the CDC website National Health Expenditure Data, which links to documents and spreadsheets with current and historical data. This website has tons of information on heathcare services – what services were used, who paid what to whom, expenditures by age and ethnicity, and many other aspects of health care in the US today. What follows are some graphs and associated commentaries derived from the latest data (for calendar year 2023) to help understand health care funding in the US.
Follow The Money
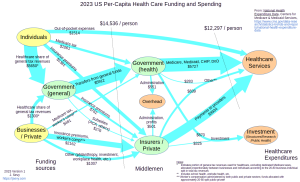
The diagram above (click to enlarge) shows how the money flowed in the US health care system, on a per-capita basis, for the year 2023 (the latest year for which CMS data was available). While the diagram looks complicated at first glance, it’s really pretty straightforward once you understand the pieces. Just think of money like water – it comes from somewhere (“sources”), flows through “pipes” and “junctions”, and ends up somewhere (“sinks” or drains).
- The arrows indicate the flow of money from one entity to another – they’re the “pipes”. For example, the “Out-of-pocket expenses” arrow from “Individuals” to “Healthcare Services” indicates that individuals paid $1514 per person on average directly to healthcare service providers (doctors, pharmacies, test facilities, etc.) The “Medicare, Medicaid, ChIP, DoD” arrow indicates that the government paid $5727 per person on average to service providers as part of these programs. The width of each arrow reflects the size of the flow – the bigger the transfer, the thicker the arrow.
- The yellow nodes (ovals) represent the “sources” of funds – where the money comes from. There are just two sources: individuals and businesses (including private non-governmental organizations). All money originates from either people or businesses/organizations – any money coming from the government has to first be provided in the form of tax receipts or bond issues, and the money for these ultimately come from either people or businesses. (This is a slight oversimplification – there may be some investment income that the government earns itself on things like trust funds, but this is a relatively small contributor in the healthcare domain.)
- The orange nodes represent the final recipients of funds, or “sinks” – it’s where the money ends up, paid to the people and organizations providing medical services.
- The green nodes are the middlemen (the “junctions”) – these are organizations that collect and pass on funds. We represent these by three “junction” ovals – insurance companies, and the government, with the government broken into two components (general and health-care-specific). Like a pipe junction, we assume that these don’t keep any of what they receive – we break out the overhead that they charge (money that gets paid to employees, or shareholders, or for other business expenses) as its own orange “sink” node in the middle of the diagram.
The Size Of The Problem
One of the first things to note is just how much we spend on healthcare. The dotted line on the left side of the diagram labels a “cut” in the graph; summing all the flows through this cut shows how much money flows across that boundary. This shows that we spent $14,536 per person for healthcare in the US in 2015. That’s almost $15,000 for every man, woman and child. If you’re trying to find a way to solve the healthcare dilemma, that’s a good place to start – either reduce costs, or make sure you have a way to generate that much money through insurance payments, tax revenues and out-of-pocket expenses – per person.
Well, isn’t a lot of this for profits and overhead and research and the like? Looking at just payments to service providers, which the right-hand dotted-line “cut” across the graph represents, we still paid $12,297 per person for medical services in 2023.
Many folks have been angered by the cost of health insurance – either the increase in their payroll deductions, or more dramatically, the cost of individual insurance on one of the markets. But from the above, if you’re not paying about $15,000 annually for each member of your family, then somebody else is: either your employer, or other folks (probably through taxes). Whatever goes out has to come in from somewhere, and if it’s not coming out of your pocket it’s coming from somebody else’s.
Wait A Minute – I Didn’t Use $15,000 Of Services Last Year! Nor Did Anyone In My Family!
Luckily, most of us can say this – we didn’t have cancer, or heart disease, or joint replacement, or any of the myriad other medical conditions that will quickly raise your annual healthcare bill way above the $15,000 average. But those unfortunates who did are being supported by the fortunate – and in fact that’s the key to insurance and social programs. We don’t each just “pay our own way”, we all pay for everyone. That’s the way our society works, thankfully.
Insurance Company Profits Are The Problem! Government Waste Is The Problem!
Well, no. Looking at the graph, we see that the government pays out $6880 per person on average (for healthcare services, investment, and administrative overhead), while insurers pay out $5098. Of these amounts, the amount paid for overhead for government programs is $551 per person, while that for insurers is $501. Thus the percent of government healthcare spending that goes to administration is 551/7431 = 7.4%, while the overhead for private insurers (which includes profit) is 501/5599 = 9.0%. While government does come out looking more efficient than private insurers, neither of these is a huge fraction of our healthcare spending.
Old And In The Way
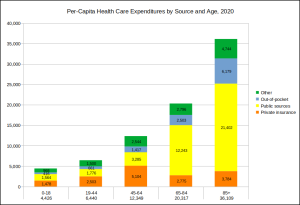
Who are the worst offenders in the above-average spending category? Well, you could probably have guessed it – it’s us old folks. Yep, you young people have to pay much more for health insurance than you use, to support the variety of delightful age-related conditions that we elders enjoy. The graph below, from 2020 (the latest year for which statistics were available), shows just how much of a problem we are.
But before you throw grandma from the train, remember that we’re the ones who wiped your collective butts when you were kids, and we’re probably watching your kids right now while you’re at work or the gym. So we’ve kind of earned our subsidy – thanks, and you’re welcome. Even if that doesn’t move you, consider that (if you’re lucky) you’ll one day end up as achy and expensive as we are, at which point your kids will get to subsidize you just as you’re doing for us. You’ll probably have noticed that the authors of the song with the phrase “I hope I die before I get old” are still very much with us and in their 70’s and 80’s. Just saying…
What Goes Up, Keeps Going Up
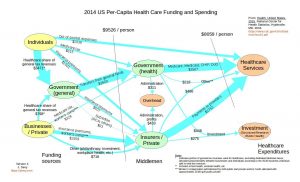
Unfortunately, the health care system itself seems to be getting more expensive with age. Here is the money flow graph showing the situation in 2014, about a decade ago – all of the arrows have gotten fatter since then. Some of the increase in cost can be attributed to inflation, of course, but health care itself is one of the strongest contributors to inflation. Using a handy online inflation calculator, the $9526 we spent per person in 2014 would have cost $12,260 in 2023 due to inflation as measured by the overall consumer-price index, instead of the $14,536 we actually spent. Health care inflation almost always outpaces the general consumer-price-index inflation.
So What’s The Answer??
Hey, I’m just a math guy, not a genie – I don’t know. But really there are only two ways to address this: find a way to pay for it, or cut costs.
Don’t Get Sick
One way to cut costs is to use fewer services. Unfortunately, much of the time we don’t choose to use healthcare services in the same way we choose to get our car washed or our dog groomed. In fact, healthcare is in general one service that we’d actual prefer NOT to be using. We use healthcare because we really have to do something about that broken leg or persistent fever. And most of those healthcare services that are elective are also the ones that prevent much more serious (= expensive) conditions from developing. So using less – “cutting back” – is likely to be counter-productive.
Oh, but there is actually a “magic bullet” – no, I’m not kidding or exaggerating. There’s a readily-available treatment that:
- improves cardiovascular and insulin function
- improves executive function – our ability to pay attention, plan, organize, and remember
- reduces the symptoms of major psychological disorders such as schizophrenia, depression, and Alzheimer’s disease
- increases life expectancy
Oh, and one more thing: it’s free. I’ll let you click on the link above to find out what it is (if you haven’t already guessed). Don’t hate me. I’m just putting it out there.
Your Personal Shopper
Another way to cut costs is to negotiate down the price paid for services. I know, the notion of bargaining with your heart surgeon to get a sweetheart deal on that bypass is probably not going to make your healthcare experience more attractive, but this deal-making is actually currently going on all the time, just not by the individual patient. Insurance companies strike deals with medical providers, getting them to accept a lower payment for each service than the “list price”. If you have insurance, you’re directly getting this benefit. You might have noticed on medical bills that the amount paid (either by you through a deductible, or by your insurance company) is significantly less than the list price for the service. This discount is what your insurance company has negotiated with your medical provider as the amount its customers will have to pay. If you don’t have insurance, you’re charged the list price; you can often negotiate this down, but it’s on you to do it, and you’re likely not at your best considering you’re anticipating or have just had medical treatment.
Uncle Sam Strikes A Deal
 Interestingly, one of the best negotiators is the government. The amount paid by Medicare to medical providers as full compensation for medical services is on average just 36% of the asking price. That’s a pretty astonishing deal! Some analogues:
- If you were as effective in negotiating the price of your new Ford F-150 XLT, instead of paying the MSRP of $45,595, you’d pay $16,414
- If you got the same deal on gasoline here in Pennsylvania, instead of paying $3.25 per gallon, you’d pay $1.17
- If your haggling skills were up to these standards, instead of paying $400,000 for that new home you’d pay $144,000
If the government hadn’t been this effective at negotiating, our medical expenses would be much, much larger than $15,000 per person. And they say that government is wasteful and inefficient…
Drugs – Just Say No (Negotiating)
 Hey, what about drugs? We spend a lot on medications; do we get the same deal from those crafty government negotiators that we get on medical services? The short answer is: hell no, and you can thank your congressman.
“Under current law, the Secretary of the Department of Health and Human Services (HHS) is explicitly prohibited from negotiating directly with drug manufacturers on behalf of Medicare Part D enrollees.”
0%. That’s how much of a discount Medicare is able to negotiate on prescription drug prices for Medicare Part D. Those lucky pharmaceutical firms, eh? Guess a good lobbyist is worth his weight in gold… Not surprisingly, this isn’t a situation that the majority of citizens are happy with:
“In response to higher drug spending growth and heightened attention to drug prices, some policymakers have proposed allowing Medicare to negotiate the price of prescription drugs—a proposal supported by 82 percent of the public, including a majority of Democrats (93%), Republicans (68%), and Independents (85%)”
(From the Kaiser Family Foundation, “Searching for Savings in Medicare Drug Price Negotiations”.)The only thing I find surprising is that 18% of the public DON’T support this… But the other 82% of us should be able to get our representatives to fix this. Really. As a start, the Inflation Reduction Act passed by congress and signed into law by the Biden administration in 2022 allows the Center for Medicare and Medicaid Services to negotiate for the first time the prices of 15 drugs per year starting in 2027 (and rising to 20 drugs per year in 2029). While that’s great news, the fact that a typical Medicare Part D Drug Plan formulary contains hundreds to thousands of drugs suggests it’s going to take quite a while to get the drug cost problem under control.
Conclusion
The bottom line is that health care in the US is really, really expensive. And regardless of who the final payer is – individuals, governments, insurance companies – the money all has to come from us, ultimately. So until we find an effective way to cut costs (as in the Medicare bargaining above), we’re going to be spending a lot.
Resources
- National Health Expenditure Data, Centers for Disease Control. Huge compendium of information and statistics on healthcare in the US.
- Medicare National/HCPCS Aggregate table, CY2014. Comprehensive list of medical procedures, average list prices, and negotiated Medicare reimbursements
- “Searching for Savings in Medicare Drug Price Negotiations”, Kaiser Family Foundation
- How does medical inflation compare to inflation in the rest of the economy?, Peterson-KFF Health System Tracker


